Power Cycles and Power Cycle Components/Processes Ideal vs Real Operation Analysis
1h! Run Time
Employees
and
Supervisors
Provided
Friendly
Access
What you'll learn
Skills covered in this course
Description
This course analyzes basic power cycles and their components under both ideal and real operation, using air as the working fluid.
What this course covers:
- Brayton, Otto and Diesel power cycles
- Compression, combustion and expansion processes
- Thermal efficiency derivations and T-s diagrams
- Ideal versus real operation with isentropic efficiencies
- Combustion of six fuels with flame temperature and heating value data
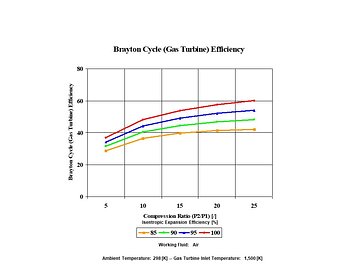
Performance trends are plotted against compression ratio, turbine inlet temperature and mass flow rate.
Table of Contents
Brayton Cycle (Gas Turbine) for Power Application
Analysis
Assumptions
Governing Equations
Input Data
Results
Conclusions
Otto Cycle
Analysis
Assumptions
Governing Equations
Input Data
Results
Conclusions
Diesel Cycle
Analysis
Assumptions
Governing Equations
Input Data
Results
Conclusions
Compression
Analysis
Assumptions
Governing Equations
Input Data
Results
Conclusions
Combustion
Analysis
Case Study A
Case Study B
Case Study C
Assumptions
Governing Equations
Input Data
Results
Case Study A
Case Study B
Case Study C
Figures
Conclusions
Expansion
Analysis
Assumptions
Governing Equations
Input Data
Results
Conclusions
System Requirements
See System Requirements in the Coggno Knowledge Base